
Afr. J. Parasitol. Mycol. Entomol. 2023, 1(1), 8; doi:10.35995/ajpme1010008
Article
Population Genomics of Plasmodium falciparum and Malaria Control Implications in Abidjan (Cote d’ivoire)
Désiré N Ehouni PharmD 1,2,* ,
Abibatou Konaté PharmD, PhD 2,3,
Steven G Nyanjom PhD 1,
Amed Ouattara PharmD, PhD 4
and
William Yavo PharmD, PhD 2,3
,
Abibatou Konaté PharmD, PhD 2,3,
Steven G Nyanjom PhD 1,
Amed Ouattara PharmD, PhD 4
and
William Yavo PharmD, PhD 2,3
,
Abibatou Konaté PharmD, PhD 2,3,
Steven G Nyanjom PhD 1,
Amed Ouattara PharmD, PhD 4
and
William Yavo PharmD, PhD 2,3
1
Department of Biochemistry, College of Health Sciences, Jomo Kenyatta University of Agriculture and Technology, Nairobi 00100, Kenya
2
Malaria Research and Control Center, National Institute of Public Health, Abidjan, Côte d’Ivoire
3
Department of Parasitology and Mycology, Pharmaceutical and Biological Sciences Training and Research Unit, University of Cocody, Abidjan, Côte d’Ivoire
4
Malaria Research Program, Center for Vaccine Development and Global Heath, University of Maryland School of Medicine, Baltimore, MD 21201, USA
*
Corresponding author: desy33@hotmail.fr; Tel.: +225-07-09-31-22-90
How to cite: Ehouni, D.N.; Konaté, A.; Nyanjom, S.G.; Ouattara, A.; Yavo, W. Population Genomics of Plasmodium falciparum and Malaria Control Implications in Abidjan (Cote d’ivoire). Afr. J. Parasitol. Mycol. Entomol., 2023, 1(1): 8; doi:10.35995/ajpme1010008.
Received: 27 June 2023 / Accepted: 12 July 2023 / Published: 9 March 2023
Abstract
:Introduction: The onset of Plasmodium falciparum (P. falciparum) resistance to antimalarial drugs requires the careful surveillance of African parasite populations. Genomic tools are implemented to detect evolutionary changes that could impact malaria control and elimination strategies. Here, we evaluate the genome-wide pattern of selection and sequence variation in P. falciparum populations in Abidjan, Côte d’Ivoire. Methods: The study was conducted in three localities of Abidjan from 2013 to 2014. We collected 70 blood samples after receiving written informed consent from patients above two years of age. After extracting P. falciparum and human DNA from isolates, we performed whole-genome sequencing and used population genomics approaches to investigate the genetic diversity and complexity of infections and identify loci under positive directional selection. Results: We observed an excess of rare variants in the population, showing a clear mutation process in the isolates. Moderate Fst estimates (0.3) was detected for surfin, an immune invasion gene family. Seven iHS regions that had at least two SNPs with a score > 3.2 were identified. These regions code for genes that have been under strong directional selection. Two of these genes were the chloroquine resistance transporter (crt) on chromosome 7 and the dihydropteroate reductase (dhps) on chromosome 8. Our analyses showed that a recent selective sweep occurred for the erythrocyte membrane protein (Pfemp1). Conclusion: Our analyses identified genes under selective drug pressure and balancing selection on protective immune-specific genes. These findings demonstrate the effectiveness of genomics analyses to follow the evolution of malaria parasites and adopt appropriate strategies to eliminate malaria in Côte d’Ivoire.
Keywords:
malaria; Plasmodium falciparum; population genomics; whole-genome sequencing; Côte d’IvoireIntroduction
Despite considerable efforts by the World Health Organization (WHO) and other funding agencies, including the Gates Foundation and the United States President Malaria Initiative (PMI), Plasmodium falciparum malaria remains a major public health issue in the world, and mostly in Sub-Saharan Africa [1]. In Côte d’Ivoire, malaria is endemic and the entire population is at risk of contracting the disease, particularly pregnant women and children under the age of five [2]. Malaria incidences have plateaued during the past few years. In addition, the emergence of malaria parasite resistance to artemisinin derivatives highlighted the need to monitor parasite populations [3,4]. Investigating the genetic profile of P. falciparum may allow us to detect evolutionary changes that can have an impact on malaria control efforts.
During the past decade, genomics and genetics studies have been conducted to identify P. falciparum markers associated with disease characteristics and symptoms. These studies provided valuable information for malaria control and elimination by identifying P. falciparum markers associated with disease severity, resistance to drugs, and escape from the human immune system [5,6,7]. Hence, a population genomics study of P. falciparum in a single endemic population in The Gambia identified new genes under balancing selection, including the apical membrane antigen 1 gene (ama1), which encodes a prime vaccine candidate [8]. In addition, a study in Nigeria detected regions that were actively maintained in the gene, presumably a signature of adaptation to drug pressure and host immunity [9]. No evidence of a very little sub-population of the P. falciparum population has been found across West Africa [5]. These findings suggest that gene flow occurs between regions, despite differences in transmission seasonality and local vector species abundances [10,11,12]. However, studies have also shown that the malaria parasites population structure is increasing in low-transmission-level areas [13,14]. The emergence of multigenic drug resistance has been favored by high rates of inbreeding that could be estimated using within-host diversity [14,15,16]. The malaria transmission intensities and parasite genetic diversities vary greatly across West Africa regions due to variation in rainfall seasonality, indicating more highly mixed genotype infections in Guinea than those in The Gambia [17]. In Côte d’Ivoire, the transmission of malaria occurs all year round, with seasonal peaks during the rainy seasons. It is imperative to assess the genetic diversity of individual infections (within host diversity) relative to the genetic diversity of parasite populations as a whole. A recent genome-wide scan of P. falciparum revealed loci under selection in known drug targets, such as crt (chloroquine resistance transporter), dhps (dihydropteroate synthase), and dhfr (dihydrofolate reductase), in two localities in Ghana [12]. Other studies conducted in Senegal, The Gambia and Guinea [7,10,18,19] reported evidence of signatures of selection surrounding the genes involved in chloroquine (mdr1 and crt) and antifolate (dhfr and dhps) resistance. This suggests that Côte d’Ivoire could report similar patterns since it reflects the same historical drug use pattern as the above countries do. Although the population genomics of P. falciparum in West Africa have shown strong positive selection for known drug-resistant genes, inferences of local mechanisms require us to look more distinctively at individual populations such as those in Côte d’Ivoire.
The authors of this study assessed the genetic profile of circulating P. falciparum strains and aimed to understand the genome-wide patterns of selection in Côte d’Ivoire. Using samples from different localities (Abobo, Koumassi and Yopougon), we studied whether there is a significant population substructure in Côte d’Ivoire and measured the complexity of infection between three localities of the country. Finally, we identified genes that could be under recent positive selection and balancing selection.
Methods
Ethics Statement
Approval to collect and analyze clinical isolates was granted by the National Ethics and Research Committee of Côte d’Ivoire (CNER-CI) according to the protocols and standard operating procedures of Good Clinical Practices of the ICH harmonized Triplicate Guidelines for Good Clinical Practice and the Helsinki Declaration on human being research. Samples were collected following the acquisition of written informed consent from patients or their legal guardians for study participants under 18 years old.
Study Sites and Sampling of Plasmodium falciparum from Clinical Isolates
Abidjan is an urban malaria endemic city on the southern Atlantic coast in Côte d’Ivoire, on the Gulf of Guinea, in West Africa. Malaria transmission occurs often in Abidjan, with recrudescence during the rainy season occurring from July to November.
Blood samples were collected from September 2013 to February 2014 during the rainy and dry seasons in local health facilities located across three localities in Abidjan (Figure 1) including Abobo (5°25’N, 4°1’W), Koumassi (5°18’N, 3°57’W) and Yopougon (5°19’N, 4°4’W). These samples were collected in the context of the Plasmodium Diversity Network in Africa (PDNA) project (206194, 090770). Our study involved 70 samples collected from study participants, including 31 from Abobo, 19 from Koumassi and 20 from Yopougon. Patients were eligible for recruitment if they were aged 2 years and above, presented with an axillary temperature of 37.5 °C or had a history of fever during the last 24 hours. After administrating informed consent forms, 5 mL of venous blood sample was collected in ethylenediaminetetraacetic acid vacutainers (EDTA), and leukocytes were depleted using CF11 cellulose columns and frozen at −20 °C. P. falciparum. DNA was later extracted using the QI Amp blood mini kit (Qiagen, UK), followed by the whole-genome sequencing of P. falciparum.
Whole-Genome Sequencing of Plasmodium falciparum from Clinical Isolates
DNA from 70 clinical samples collected in Abidjan were prepared for library generation and whole-genome sequencing using an Illumina HiSeq platform at the Wellcome Trust Sanger Institute, UK, as part of the MalariaGen P. falciparum Community project [21]. Standard laboratory protocols were used to determine DNA quantity and the proportion of human DNA in each sample. Samples were put forward for whole-genome Illumina paired-end sequencing [14,22]. All the 70 samples passed the whole-genome sequencing quality standards. Sequenced reads were mapped to the P. falciparum 3D7 reference genome using bwa mem, version 0.7.15, with -M parameter to mark shorter split hits as secondary [23]. Standard alignment metrics were generated for each sample using the stats utility from sam tools, version 1.2 [24]. We also used GATK’s CallableLoci (version 3.5) to determine the proportion of genomic positions that could be identified in each sample [25]. Potential SNPs (Single-Nucleotide Polymorphisms) and indels were discovered by running GATK’s HaplotypeCaller (version 3.6) independently for each of the 70 sample-level bam files. This resulted in genotype calls for both SNPs and short indels. SNPs and indels were filtered separately. Each variant was assigned a quality score using GATK’s Variant Quality Score Recalibration (VQSR), version 3.6. The tools, VariantRecalibrator and ApplyRecalibration, were used for this purpose. Regions of the genome that we previously identified as being enriched for errors were masked out. VariantsRecalibrator was employed using the PASS variants from P. falciparum crosses as a training set, 1.0 release. For SNPs, we previously used 15.0 for the training set variants. ApplyRecalibration was then used to assign each variant a quality score named VQSLOD (Variant quality score). Higher values of VQSLOD indicate a higher quality. Variants (both SNPs and indels) with a VQSLOD score under or equal to 0 were filtered out. Variants were excluded from the analysis if they were positioned within subtelomeric regions located within the hypervariable Var, Rifin, and Stevor gene families, or were positioned within repetitive sequences as identified using Tandem Repeat Finder. Data were then filtered out to extract 89578 bi-allelic SNPs in the core genome with a VQSLOD score greater than 6. In addition, we filtered out those SNPs to exclude isolates with missing calls greater than 10% in all positions and SNPs with calls missing in more than 10% of isolates. A total of 89211 SNPs remained after filtering.
Determination of Allele Frequencies and Balancing Selection
Analysis of allele frequency distributions, including within-population Tajima’s D test, was performed using Vcftools and custom R scripts to identify genes under balancing selection [26]. For Tajima’s D test, we extracted bi-allelic SNPs that were segregating within our population. Missing data were excluded via the removal of 8 individual isolates on a gene-by-gene basis due to the observation that most of missing data clustered within a small number of isolates. The allele frequency spectrum for each gene was assessed with at least 3 SNPs using custom R scripts. Typable SNPs in this study were classified as synonymous or non-synonymous based on amino acids changes and compared to the 3D7 reference genome sequence. The ancestral state of SNPs was determined by comparing each sequence to homologous sequences in Plasmodium reichenowi (Pr), a parasite with recent common ancestry.
Identification of Intra-Population Signatures of Recent Selection Sweep
To detect loci under recent positive selection, we computed the standardized integrated Haplotype Score (| iHS |) for each SNP with no missing data and a minimum minor allele frequency of 0.05 using the REHH R software package. iHS was calculated for each SNP with no missing data and a minor allele frequency greater than 0.05 [27]. The genetic map distance between markers inferred with LDhat 2.2 [28] was measured using a block penalty of 10 million rjMCMC iterations and a burn-in of 100 000 iterations. Selection windows were defined by calculating the distance required for the extended haplotype homozygosity of each SNP to decay to a level of 0.05 in each direction. Overlapping EHH windows from individual high-scoring SNPs (|iHS| >3.29, suggestive line) were combined into continuous windows, and windows supported by only a single SNP position were subsequently discarded. Bonferoni correction was applied for genome-wide significance. Reference and non-reference alleles were described as ancestral and derived alleles, respectively. For significance, the REHH package generated a two-sided p-value where Ф (iHS) represents the Gaussian cumulative distribution function.
Complexity of Infection with Fws
Infection complexity was determined using the Fws fixation index [14,29] using the moimix package in R and computed with R scripts. For all bi-allelic-coding SNPs, Fws was calculated using the formula, Fws = 1 − (Hw /Hs), where Hw is the within-individual heterozygosity and Hs is the within-population heterozygosity. For each bi-allelic SNP, heterozygosity was estimated using the formula, H = 1 − (p2 − q2), where p and q are the frequencies of the two alleles (p = 1 − q). At each SNP, p and q were estimated for each sequence as the proportions of sequencing reads that carried each allele in the individual sample. At the population level, the allele frequencies at the SNPs level were estimated as the mean of the allele frequencies in the individual composing the population sample. The minor allele frequency (MAF) was reported as the frequency of the least common allele for that SNP. Within-individual and within-population heterozygosities were computed and assigned to ten equal-sized MAF bins from [0.0–0.05] to [0.45–0.5], and for each bin, the mean within-sample and population heterozygosities were computed.
Population structure, Principal Component Analysis (PCA) and Fst-metric
We conducted PCA and Fst analysis, as implemented using PLINK1.9 and Vcftools, respectively, to assess the structure of study populations. We used Weir and Cockerham’s population genetic differentiation estimator, Fst, to study the sites [30]. For PCA, we applied the Linkage Disequilibrium correction to remove correlated pairs of SNPs and identity by descent (IBD) to identify and remove any closely related samples before computing the principal components (PCs). We further calculated the top 10 eigenvectors from the population genotype. R statistical package was used to analyze our data. For Fst analysis, missing data for some isolates were excluded on a per SNP basis.
Results
Following the quality control of all 70 clinical samples, we extracted 89578 bi-allelic SNPs in the core genome with a VQSLOD score greater than six SNPs. Missing calls greater than 10% were excluded (367 SNPs) from analysis, leaving 89211 SNPs for all isolates.
Allele Frequency Distribution and Balancing Selection
There was an excess of rare variants in the population, with the majority (80%) being single isolates (Figure 2A). The coding sequences had higher coverage than the intergenic regions did, probably due to A + T allelic richness. There was an excess of non-synonymous SNPs compared to the number of synonymous SNPs, showing a clear mutation process in the isolates (Figure 2B).
Genes with at least three SNPs had their allele frequency distribution assessed via computing a Tajima’s D statistic based on 16697 SNPs. For the 262 genes analyzed, Tajima’s D values were mostly negative (mean = −0.15), with only 47 genes (18%) having positive Tajima’s D values, indicating an excessively low frequency compared with that which was expected for a mutation-drift equilibrium population (Figures S1 and S2). At the whole-genome level, we identified 18 genes with Tajima’s D values greater than one (Table S1). PfEMP1, SURFIN 4.2, GLURP, and msp7-lik were the most significantly represented genes.
Evidence of Signature of Positive Directional Selection in Côte d’Ivoire
We conducted a scan of the whole genome of P. falciparum using the REHH package in R. Via an assessment of the standardized integrated Haplotype score (| iHS |), we identified a recent positive selection in seven loci that had four or more SNPs with a standardized | iHS | value greater than 3.2 (suggestive line) (Figure 3A) and four loci that had at least one SNP with an | iHS | greater than 5 (Figure 3B and Table 1). We identified windows containing genes that have been under strong and recent positive selection. Indeed, there was a strong signature surrounding one of the major chloroquine resistance gene, Pfcrt on chromosome 7. In addition, a strong signature was also observed around genes encoding erythrocyte membrane protein 1 (PfEMP1), a gene involved in the adhesion of P. falciparum to endothelial cells. Pfdhps, a drug-resistant gene located on chromosome 8, was also found to be under positive selection. No detectable signature was found around multi-drug-resistant and anti-folate drug target genes, mdr1 and dhfr, respectively. Another region with a very high | iHS | value on chromosome 11 had SNPs within the ama1 gene. Windows spanning regions of elevated | iHS | values were also observed on chromosome 10 and 13, covering genes encoding for the merozoite surface protein 7 like antigen, Pftrap (Thrombospodin-related adhesive protein), GLURP (Glutamate-Rich Protein) and msp3 (merozoite surface protein 3).
Assessing the Genome-Wide Complexity of Infection (Fws)
The within-infection Fws fixation index describes the relationship between the diversity observed within a patient to that of the population using estimates of heterozygosity. It provides a measure of the risk of outcrossing between parasites within an individual to generate new genotypes during recombination in a mosquito host [29]. In our analysis, the Fws scores ranged from 0.50 to 0.99 (mean 0.89; median 0.98), with 64% samples presenting high Fws estimates (i.e., >0.95; Figure S3).
Population Structure and Differentiation
We conducted principal component analysis using 89211 SNPs with no missing data in all 70 clinical samples. The first three principal components (10.8% of the total variation) were plotted and showed no evidence of population structure in most samples from the three populations. Only a few isolates appeared as outliers that were not very divergent (Figure 4).
We measured Fst to assess the genetic differentiation and evaluate the overall effect of population substructure of parasite populations. There was a minimal amount of differentiation between the populations highlighted by a very low value for the mean Fst estimate (mean 0.001) (Figure 5). Only 12 SNPs had Fst values equal or greater to 0.2, and the highest Fst value was 0.7 (Table 2).
Three of the differentiated SNPs were located on chromosome 7. The SNP at position 435368 spanned the region coding for P. falciparum esterase gene Pfpare (P. falciparum prodrug activation and resistance esterase), which is responsible for a resistance to pepstatin esters [31]. Furthermore, an SNP located on chromosome 8 encodes an amino acid within the SURFIN8.2 gene (PF3D7_0830800), a polymorphic antigen that is expressed on the surface of P. falciparum-infected erythrocytes (IE) and released merozoites [32]. The PF3D7_1035200 gene containing two SNPs with highest genome-wide Fst values were located within a single region on chromosome 10, encoding a conserved protein with an unknown function.
Discussion
P. falciparum genomic studies are the ideal tools used to assess the selection processes and evolution patterns of parasite populations [7,33]. In this study, we sequenced the whole genome of 70 P. falciparum clinical isolates from Côte d’Ivoire to identify signatures of selection and migration.
Our findings suggest a strong and recent positive selection occurred on Pfcrt and Pfdhps, two malaria drug-resistant genes. These findings have been corroborated in previous studies conducted in Ghana, Guinea, The Gambia and Senegal [7,12,17] and are reflective of the selective pressure induced by antimalarial drug treatments on the West African parasite population. Chloroquine was the first line of uncomplicated malaria treatment in Cote d’Ivoire until 2007. Selective pressure may have occurred when chloroquine and sulfadoxine-pyrimethamine were widely used as first lines of antimalarial therapies in Côte d’Ivoire. In contrast to our findings, Konaté et al. observed the local decay of the chloroquine mutation rate, rejecting the hypothesis of recent positive pressure [34]. The difference in our findings may be explained by our smaller sample size in three sites in Abidjan, the economic capital of Côte d’Ivoire, which does not really reflect the drug pressure on Pfcrt in the country. While other studies [10,19] conducted in West Africa have found a drug-induced selective pressure on Pfdhfr and Pfmdr1, our study did not corroborate these findings. We hypothesize that the timing of the sample collection and malaria incidence may have been responsible for these differences. In fact, our study samples were collected from 2013 to 2014 in an urban setting, while samples from Senegal were collected from 2002 to 2009 in a peri-urban area [33]. P. falciparum virulence is attributed to the parasite’s ability to modify the erythrocyte surface to adhere and invade the host’s immune system [35]. Therefore, the PfEMP1-encoding gene is very polymorphic. We detected a high extended haplotype score around PfEMP1, highlighting the selective pressure on this gene. There is evidence of positive directional selection in msp3, glurp, ama1, msp7 and pftrap on chromosomes 10, 11 and 13, respectively, which are known as non-drug-related drivers of directional selection, as well as antigenic loci that lead drug resistance [36,37]. Some of these antigens are malaria vaccine candidates that are usually expressed in merozoites and are thought to be targets of protective immunity and under balancing selection, as described in Asian and African parasite populations [10,38].
In malaria-endemic areas, people are usually infected with multiple variants of P. falciparum [13]. The inbreeding levels determine the rates of an effective recombination and play a central role in understanding the population genomics of the parasite [39]. The within-host diversity fixation index (Fws) is used to measure the risk of inbreeding for parasites within an isolate compared to that in the whole population [14,29]. The Fws values in our study ranged from 0.5 to 0.99 (mean: 0.89), with most of the isolates having Fws estimates greater than 0.95. These results parallel findings from several studies conducted in West Africa [7,12]. The results showed the high inbreeding levels of parasites within the host, with no threat to malaria control efforts. However, a follow-up study conducted in areas bordering Côte d’Ivoire (Burkina and Mali) with a bigger sample size has shown low Fws values [29]. Further exploration of the complexity of infection is required through different epidemiological settings to enable the more effective interpretation of relative out-crossing risks associated with different Fws scores.
To assess the gene flow between the three study sites, the principal component analysis of 70 clinical samples did not show any clustering between populations, as reported recently [5]. We noticed only a few outliers that were not very divergent. Indeed, the three areas are located in the same district. The computation of Weir and Cockerham’s Fst to measure the allele frequency differentiation between the three sites with a stringent genome-wide cut-off (Fst ≥ 0.2) identified 12 highly differentiated SNPs between populations. The mean Fst was very low in our population. Similar findings were reported in studies conducted in West Africa [7,11,12], suggesting that there are many genes. Located on chromosome 7, one of these SNPs is highly differentiated around regions coding for the parasite esterase gene Pfpare, conferring resistance to pepstatin ester, which is a potent peptydil inhibitor of various malarial aspartic proteases, and also, is parasiticidal [31]. Although this compound is not used in our region, this finding could be physiologically relevant because many children in malaria-endemic regions are malnourished and contain low, even undetectable, levels of plasma amino acids [40]. The family of surfin genes also had a high Fst estimate. This protein, which is expressed at the surface of infected erythrocyte and released merozoite, may be crucial for parasites’ survival [32]. Future investigations of this protein might be needed since it is a threat to malaria intervention efforts.
To find genes under balancing selection, Tajima’s D statistic test was conducted. We identified genes with at least three SNPs under balancing selection. Most genes had negative Tajima’s D values (mean −0.15), in agreement with observation in Senegal, Nigeria, Guinea and The Gambia [7,9,33]. This may be explained by the historical bottleneck that has been discovered before in Africa [41]. Moreover, the balancing selection of genes with Tajima’s D values greater than one were observed in a subset of genes encoding known antigens (Pfemp1, glurp) and targets of immune selection (msp7-like and surfin), which is consistent with the evident decrease in population size, as shown in Kenya and other geographical locations in Africa [42,43]. However, it is notable to consider that not all genes with positive values may be under balancing selection due to the evolution of the population after a recent bottleneck.
Conclusion
This study reports the first WGS of P falciparum strains in Côte d’Ivoire to assess the signatures of selection and gene flow between study areas. We identified regions of the genome under selective pressure in drugs and vaccine-encoding genes. We have also shown the lack of differentiation of the parasite populations. The detailed understanding of P. falciparum genomics could facilitate malaria elimination. The identification of balancing selection also reinforces the theory of population expansion in Africa. It is important to notify that future investigations should be carried out on a larger sample size of the country, taking into account temporal and spatial factors to monitor the evolution of gene flow and genetic diversity of parasites in Côte d’Ivoire.
Supplementary Materials
The following are available online at https://journals.jams.pub/user/manuscripts/displayFile/972f320231441b908e286552ccffdd91/supplementary, Figure S1: Frequency distribution of Tajima’s D values for genetic loci as annotated in Pf3D7 genome, Figure S2: Genome-wide Manhattan plot of Tajima’s D values for P. falciparum genes with at least three SNPs. Chromosomes are identified by the alternate red and black coloring with genes plotted as individual points based on their position within each chromosome. The blue horizontal line discriminate negative from positive values. Genes with a Tajima’s D value greater than 1 in the three populations were represented above the horizontal purple line (genome wide line), Table S1: Genes (18) with more than 3 SNPs showing highest Tajima’s D values (>1) in a genome wide analysis of 70 Ivorian P. falciparum isolates, Figure S3: Ordered between sites (Yopougon, Abobo and Koumassi) within-infection Fws fixation index for each clinical sample with SNPs data. The horizontal blue line indicates Fws estimates > 0.95 (isolate with a single predominant genotype.
Authors Contributions
A.K. designed and supervised the clinical studies. D.E. analyzed the data and carried out bioinformatics analysis of genotype data. W.Y. was the principal investigator. D.E. drafted the first manuscript. W.Y., A.O. and S.N. provided guidance on revision of the manuscript. All authors read and approved the final manuscript.
Funding
The field component of this study was supported by The Global Fund against AIDS, Tuberculosis and Malaria through National Malaria Control Programme of the Ivorian Ministry of Public Health. The project was funded by the Developing Excellence in Leadership and Genomics for Malaria Elimination (DELGEME) program (Grant 107740/Z/15/Z) sponsored by the Developing Excellence in Leadership and Training (DELTAS) Africa Initiative, of the African Academy of Sciences (AAS). The DELTAS Africa Initiative is an independent funding scheme of the African Academy of Sciences (AAS)’s Alliance for Accelerating Excellence in Science in Africa (AESA) and supported by the New Partnership for Africa’s Development Planning and Coordinating Agency (NEPAD Agency), with funding from the Wellcome Trust (DELGEME Grant 107740/Z/15/Z) and the UK government. Funding for bioinformatics skill development and data analysis was provided by the H3ABioNet project. The H3ABioNet is supported by the National Institutes of Health (NIH) Common Fund (Grant Number U41HG006941).
Acknowledgments
We are grateful for the hospitality and generous collaboration of the staff of the health centers in which the study took place. We thank the patients and parents of the patients included in this study for their collaboration. We also thank the MalariaGEN Oxford Resource Center for the genotyping work.
Conflicts of Interest
The authors declare that they have no competing interests.
Ethics Approval and Consent to Participate
This study followed protocols and standards operating procedures of Good Clinical Practices of the ICH harmonized Triplicate Guidelines for Good Clinical Practice made in 1996 and the Helsinki Declaration on human being research. The study protocol was reviewed and approved by the National Ethics and Research Committee (CNER). Samples were collected following a written informed consent from patients or their legal guardians for study participants under 18 years old.
Consent for Publication
Not applicable.
Availability of Data and Materials
The dataset analyzed during the current study is available through the MalariaGEN Pf3K Project. The P. falciparum genome sequences used in this study are available in the ENA and SRA databases.
Abbreviations
| WHO | World Health Organization |
| PMI | President Malaria Initiative |
| ama1 | apical membrane antigen 1 |
| Pfmdr1 | P. falciparum multi-drug resistance protein 1 |
| Pfcrt | P. falciparum chloroquine resistance transporter |
| Pfdhfr | P. falciparum dihydrofolate reductase |
| Pfdhps | P. falciparum dihydropteroate synthase |
| CNER-CI | National Ethics and Research Committee |
| PDNA | Plasmodium Diversity Network Africa |
| EDTA | Ethyl Di-amino Tetra Acetic |
| DNA | Desoxyribo Nucleic Acid |
| VQSR | Variant Quality Score Recalibration |
| VQSLOD | Variant Quality Score |
| SNP | Single-Nucleotide Polymorphism |
| Pr | Plasmodium reichenowi |
| iHS | Integrated Haplotype Score |
| MAF | Minor Allele Frequency |
| PCA | Principal Component Analysis |
| PfEMP1 | P. falciparum Erythrocyte Membrane Protein 1 |
| SURFIN | Surface-associated interspersed protein |
| msp7-like | merozoite surface protein 7 |
| GLURP | Glutamate-Rich Protein |
| Pftrap | P. falciparum Thrombospodin-related adhesive protein |
| msp3 | merozoite surface protein 3 |
| Pfpare | P. falciparum Prodrug Activation and Resistance Esterase |
| IE | Infected Erythrocyte |
References
- WHO. World Malaria Report 2018; World Health Organization: Geneva, Switzerland, 2019; Available online: http://www.who.int/malaria/publications/world-malaria-report-2018/en/ (accessed on 6 August 2019).
- USAID; CDC. U. S. President’ s Malaria Initiative Cambodia: Malaria Operational Plan FY 2020; President’s Malaria Initiative: New York, NY, USA, 2020. [Google Scholar]
- Dondorp, A.M.; Fairhurst, R.M.; Slutsker, L.; MacArthur, J.R.; Breman, J.G.; Guerin, P.J.; Wellems, T.E.; Ringwald, P.; Newman, R.D.; Plowe, C.V. The Threat of Artemisinin-Resistant Malaria. N. Engl. J. Med. 2011, 365, 1073–1075. [Google Scholar] [CrossRef] [PubMed]
- Noedl, H.; Se, Y.; Schaecher, K.; Smith, B.L.; Socheat, D.; Fukuda, M.M. Evidence of Artemisinin-Resistant Malaria in Western Cambodia. N. Engl. J. Med. 2008, 359, 2619–2620. [Google Scholar] [CrossRef] [PubMed]
- Amambua-Ngwa, A.; Amenga-Etego, L.; Kamau, E.; Amato, R.; Ghansah, A.; Golassa, L.; Randrianarivelojosia, M.; Ishengoma, D.; Apinjoh, T.; Maïga-Ascofaré, O.; et al. Major Subpopulations of Plasmodium Falciparum in Sub-Saharan Africa. Science (1979) 2019, 365, 813–816. [Google Scholar] [CrossRef]
- Duffy, C.W.; Amambua-Ngwa, A.; Ahouidi, A.D.; Diakite, M.; Awandare, G.A.; Ba, H.; Tarr, S.J.; Murray, L.; Stewart, L.B.; D’Alessandro, U.; et al. Multi-Population Genomic Analysis of Malaria Parasites Indicates Local Selection and Differentiation at the Gdv1 Locus Regulating Sexual Development. Sci. Rep. 2018, 8, 15763. [Google Scholar] [CrossRef] [PubMed]
- Mobegi, V.A.; Duffy, C.W.; Amambua-Ngwa, A.; Loua, K.M.; Laman, E.; Nwakanma, D.C.; MacInnis, B.; Aspeling-Jones, H.; Murray, L.; Clark, T.G.; et al. Genome-Wide Analysis of Selection on the Malaria Parasite Plasmodium Falciparum in West African Populations of Differing Infection Endemicity. Mol. Biol. Evol. 2014, 31, 1490–1499. [Google Scholar] [CrossRef]
- Amambua-Ngwa, A.; Tetteh, K.K.A.; Manske, M.; Gomez-Escobar, N.; Stewart, L.B.; Deerhake, M.E.; Cheeseman, I.H.; Newbold, C.I.; Holder, A.A.; Knuepfer, E.; et al. Population Genomic Scan for Candidate Signatures of Balancing Selection to Guide Antigen Characterization in Malaria Parasites. PLoS Genet. 2012, 8, e1002992. [Google Scholar] [CrossRef]
- Oyebola, K.M.; Idowu, E.T.; Olukosi, Y.A.; Awolola, T.S.; Amambua-Ngwa, A. Pooled-DNA Sequencing Identifies Genomic Regions of Selection in Nigerian Isolates of Plasmodium Falciparum. Parasit. Vectors 2017, 10, 320. [Google Scholar] [CrossRef]
- Amambua-Ngwa, A.; Park, D.J.; Volkman, S.K.; Barnes, K.G.; Bei, A.K.; Lukens, A.K.; Sene, P.; van Tyne, D.; Ndiaye, D.; Wirth, D.F.; et al. SNP Genotyping Identifies New Signatures of Selection in a Deep Sample of West African Plasmodium Falciparum Malaria Parasites. Mol. Biol. Evol. 2012, 29, 3249–3253. [Google Scholar] [CrossRef]
- Duffy, C.W.; Ba, H.; Assefa, S.; Ahouidi, A.D.; Deh, Y.B.; Tandia, A.; Kirsebom, F.C.M.; Kwiatkowski, D.P.; Conway, D.J. Population Genetic Structure and Adaptation of Malaria Parasites on the Edge of Endemic Distribution. Mol. Ecol. 2017, 26, 2880–2894. [Google Scholar] [CrossRef]
- Duffy, C.W.; Assefa, S.A.; Abugri, J.; Amoako, N.; Owusu-Agyei, S.; Anyorigiya, T.; MacInnis, B.; Kwiatkowski, D.P.; Conway, D.J.; Awandare, G.A. Comparison of Genomic Signatures of Selection on Plasmodium Falciparum between Different Regions of a Country with High Malaria Endemicity. BMC Genom. 2015, 16, 1–11. [Google Scholar] [CrossRef]
- Anderson, T.J.C.; Haubold, B.; Williams, J.T.; Estrada-Franco, J.G.; Richardson, L.; Mollinedo, R.; Bockarie, M.; Mokili, J.; Mharakurwa, S.; French, N.; et al. Microsatellite Markers Reveal a Spectrum of Population Structures in the Malaria Parasite Plasmodium Falciparum. Mol. Biol. Evol. 2000, 17, 1467–1482. [Google Scholar] [CrossRef] [PubMed]
- Manske, M.; Miotto, O.; Campino, S.; Auburn, S.; Zongo, I.; Ouedraogo, J.; Michon, P.; Mueller, I.; Su, X.; Amaratunga, C.; et al. Europe PMC Funders Group Analysis of Plasmodium Falciparum Diversity in Natural Infections by Deep Sequencing. Nature 2013, 487, 375–379. [Google Scholar] [CrossRef] [PubMed]
- Dye, C.; Williams, B.G. Multigenic Drug Resistance among Inbred Malaria Parasites. Proc. R. Soc. B Biol. Sci. 1997, 264, 61–67. [Google Scholar] [CrossRef] [PubMed]
- Paul, R.E.L.; Packer, M.J.; Walmsley, M.; Lagog, M.; Ranford-Cartwright, L.C.; Paru, R.; Day, K.P. Mating Patterns in Malaria Parasite Populations of Papua New Guinea. Science (1979) 1995, 269, 1709–1711. [Google Scholar] [CrossRef]
- Mobegi, V.A.; Loua, K.M.; Ahouidi, A.D.; Satoguina, J.; Nwakanma, D.C.; Amambua-Ngwa, A.; Conway, D.J. Population Genetic Structure of Plasmodium Falciparum across a Region of Diverse Endemicity in West Africa. Malar. J. 2012, 11, 1–9. [Google Scholar] [CrossRef]
- Nwakanma, D.C.; Duffy, C.W.; Amambua-Ngwa, A.; Oriero, E.C.; Bojang, K.A.; Pinder, M.; Drakeley, C.J.; Sutherland, C.J.; Milligan, P.J.; Macinnis, B.; et al. Changes in Malaria Parasite Drug Resistance in an Endemic Population over a 25-Year Period with Resulting Genomic Evidence of Selection. J. Infect. Dis. 2014, 209, 1126–1135. [Google Scholar] [CrossRef]
- Park, D.J.; Lukens, A.K.; Neafsey, D.E.; Schaffner, S.F.; Chang, H.H.; Valim, C.; Ribacke, U.; van Tyne, D.; Galinsky, K.; Galligan, M.; et al. Sequence-Based Association and Selection Scans Identify Drug Resistance Loci in the Plasmodium Falciparum Malaria Parasite. Proc. Natl. Acad. Sci. USA 2012, 109, 13052–13057. [Google Scholar] [CrossRef]
- Fichier: Abidjan Communes.svg—Wikipédia. Available online: https://fr.m.wikipedia.org/wiki/Fichier:Abidjan_Communes.svg (accessed on 21 February 2023).
- Ahouidi, A.; Ali, M.; Almagro-Garcia, J.; Amambua-Ngwa, A.; Amaratunga, C.; Amato, R.; Amenga-Etego, L.; Andagalu, B.; Anderson, T.J.C.; Andrianaranjaka, V.; et al. An Open Dataset of Plasmodium Falciparum Genome Variation in 7,000 Worldwide Samples. Wellcome Open Res. 2021, 6, 42. [Google Scholar] [CrossRef]
- Miotto, O.; Almagro-Garcia, J.; Manske, M.; MacInnis, B.; Campino, S.; Rockett, K.A.; Amaratunga, C.; Lim, P.; Suon, S.; Sreng, S.; et al. Multiple Populations of Artemisinin-Resistant Plasmodium Falciparum in Cambodia. Nat. Genet. 2013, 45, 648–655. [Google Scholar] [CrossRef]
- Li, H.; Durbin, R. Fast and Accurate Short Read Alignment with Burrows-Wheeler Transform. Bioinformatics 2009, 25, 1754–1760. [Google Scholar] [CrossRef]
- Li, H.; Handsaker, B.; Wysoker, A.; Fennell, T.; Ruan, J.; Homer, N.; Marth, G.; Abecasis, G.; Durbin, R. The Sequence Alignment/Map Format and SAMtools. Bioinformatics 2009, 25, 2078–2079. [Google Scholar] [CrossRef] [PubMed]
- Depristo, M.A.; Banks, E.; Poplin, R.; Garimella, K. v.; Maguire, J.R.; Hartl, C.; Philippakis, A.A.; del Angel, G.; Rivas, M.A.; Hanna, M.; et al. A Framework for Variation Discovery and Genotyping Using Next-Generation DNA Sequencing Data. Nat. Genet. 2011, 43, 491–501. [Google Scholar] [CrossRef] [PubMed]
- Tajima, F. Statistical Method for Testing the Neutral Mutation Hypothesis by DNA Polymorphism. Genetics 1989, 123, 585–595. [Google Scholar] [CrossRef] [PubMed]
- Voight, B.F.; Kudaravalli, S.; Wen, X.; Pritchard, J.K. A Map of Recent Positive Selection in the Human Genome. PLoS Biol. 2006, 4, 0446–0458. [Google Scholar] [CrossRef]
- McVean, G.; Awadalla, P.; Fearnhead, P. A Coalescent-Based Method for Detecting and Estimating Recombination from Gene Sequences. Genetics 2002, 160, 1231–1241. [Google Scholar] [CrossRef]
- Auburn, S.; Campino, S.; Miotto, O.; Djimde, A.A.; Zongo, I.; Manske, M.; Maslen, G.; Mangano, V.; Alcock, D.; MacInnis, B.; et al. Characterization of Within-Host Plasmodium Falciparum Diversity Using next-Generation Sequence Data. PLoS ONE 2012, 7. [Google Scholar] [CrossRef]
- Weir, B.S.; Cockerham, C.C. Estimating F-Statistics for the Analysis of Population Structure. Evolution (N Y) 1984, 38, 1358. [Google Scholar] [CrossRef]
- Istvan, E.S.; Mallari, J.P.; Corey, V.C.; Dharia, N.V.; Marshall, G.R.; Winzeler, E.A.; Goldberg, D.E. Esterase Mutation Is a Mechanism of Resistance to Antimalarial Compounds. Nat. Commun. 2017, 8, 1–8. [Google Scholar] [CrossRef]
- Winter, G.; Kawai, S.; Haeggström, M.; Kaneko, O.; von Euler, A.; Kawazu, S.I.; Palm, D.; Fernandez, V.; Wahlgren, M. SURFIN Is a Polymorphic Antigen Expressed on Plasmodium Falciparum Merozoites and Infected Erythrocytes. J. Exp. Med. 2005, 201, 1853–1863. [Google Scholar] [CrossRef]
- Chang, H.H.; Park, D.J.; Galinsky, K.J.; Schaffner, S.F.; Ndiaye, D.; Ndir, O.; Mboup, S.; Wiegand, R.C.; Volkman, S.K.; Sabeti, P.C.; et al. Genomic Sequencing of Plasmodium Falciparum Malaria Parasites from Senegal Reveals the Demographic History of the Population. Mol. Biol. Evol. 2012, 29, 3427–3439. [Google Scholar] [CrossRef]
- Konaté, A.; Gnagne, P.A.; Bédia-Tanoh, V.A.; Amiah-Droh, M.; Tano, D.K.; Ignace Eby Menan, H.; Yavo, W. Low Rates of Plasmodium Falciparum Pfcrt K76T Mutation in Three Sentinel Sites of Malaria Monitoring in Côte d’Ivoire. Acta Parasitol. 2018, 63, 795–801. [Google Scholar] [CrossRef] [PubMed]
- Pasternak, N.D.; Dzikowski, R. PfEMP1: An Antigen That Plays a Key Role in the Pathogenicity and Immune Evasion of the Malaria Parasite Plasmodium Falciparum. Int. J. Biochem. Cell Biol. 2009, 41, 1463–1466. [Google Scholar] [CrossRef] [PubMed]
- Nguitragool, W.; Bokhari, A.A.B.; Pillai, A.D.; Rayavara, K.; Sharma, P.; Turpin, B.; Aravind, L.; Desai, S.A. Malaria Parasite Clag3 Genes Determine Channel-Mediated Nutrient Uptake by Infected Red Blood Cells. Cell 2011, 145, 665–677. [Google Scholar] [CrossRef]
- van Tyne, D.; Park, D.J.; Schaffner, S.F.; Neafsey, D.E.; Angelino, E.; Cortese, J.F.; Barnes, K.G.; Rosen, D.M.; Lukens, A.K.; Daniels, R.F.; et al. Identification and Functional Validation of the Novel Antimalarial Resistance Locus PF10_0355 in Plasmodium Falciparum. PLoS Genet. 2011, 7, e1001383. [Google Scholar] [CrossRef] [PubMed]
- Borrmann, S.; Straimer, J.; Mwai, L.; Abdi, A.; Rippert, A.; Okombo, J.; Muriithi, S.; Sasi, P.; Kortok, M.M.; Lowe, B.; et al. Genome-Wide Screen Identifies New Candidate Genes Associated with Artemisinin Susceptibility in Plasmodium Falciparum in Kenya. Sci. Rep. 2013, 3, 3318. [Google Scholar] [CrossRef]
- Nkhoma, S.C.; Nair, S.; Cheeseman, I.H.; Rohr-Allegrini, C.; Singlam, S.; Nosten, F.; Anderson, T.J.C. Close Kinship within Multiple-Genotype Malaria Parasite Infections. Proc. R. Soc. B Biol. Sci. 2012, 279, 2589–2598. [Google Scholar] [CrossRef] [PubMed]
- Liu, J.; Istvan, E.S.; Gluzman, I.Y.; Gross, J.; Goldberg, D.E. Plasmodium Falciparum Ensures Its Amino Acid Supply with Multiple Acquisition Pathways and Redundant Proteolytic Enzyme Systems. Proc. Natl. Acad. Sci. USA 2006, 103, 8840–8845. [Google Scholar] [CrossRef]
- Joy, D.A.; Feng, X.; Mu, J.; Furuya, T.; Chotivanich, K.; Krettli, A.U.; Ho, M.; Wang, A.; White, N.J.; Suh, E.; et al. Early Origin and Recent Expansion of Plasmodium Falciparum. Science (1979) 2003, 300, 318–321. [Google Scholar] [CrossRef]
- Ochola, L.I.; Tetteh, K.K.A.; Stewart, L.B.; Riitho, V.; Marsh, K.; Conway, D.J. Allele Frequency-Based and Polymorphism-versus-Divergence Indices of Balancing Selection in a New Filtered Set of Polymorphic Genes in Plasmodium Falciparum. Mol. Biol. Evol. 2010, 27, 2344–2351. [Google Scholar] [CrossRef]
- Weedall, G.D.; Conway, D.J. Detecting Signatures of Balancing Selection to Identify Targets of Anti-Parasite Immunity. Trends Parasitol. 2010, 26, 363–369. [Google Scholar] [CrossRef]
Figure 1.
Map of Abidjan district. The three study localities (Abobo, Koumassi and Yopougon) are identified by stars [20].
Figure 1.
Map of Abidjan district. The three study localities (Abobo, Koumassi and Yopougon) are identified by stars [20].
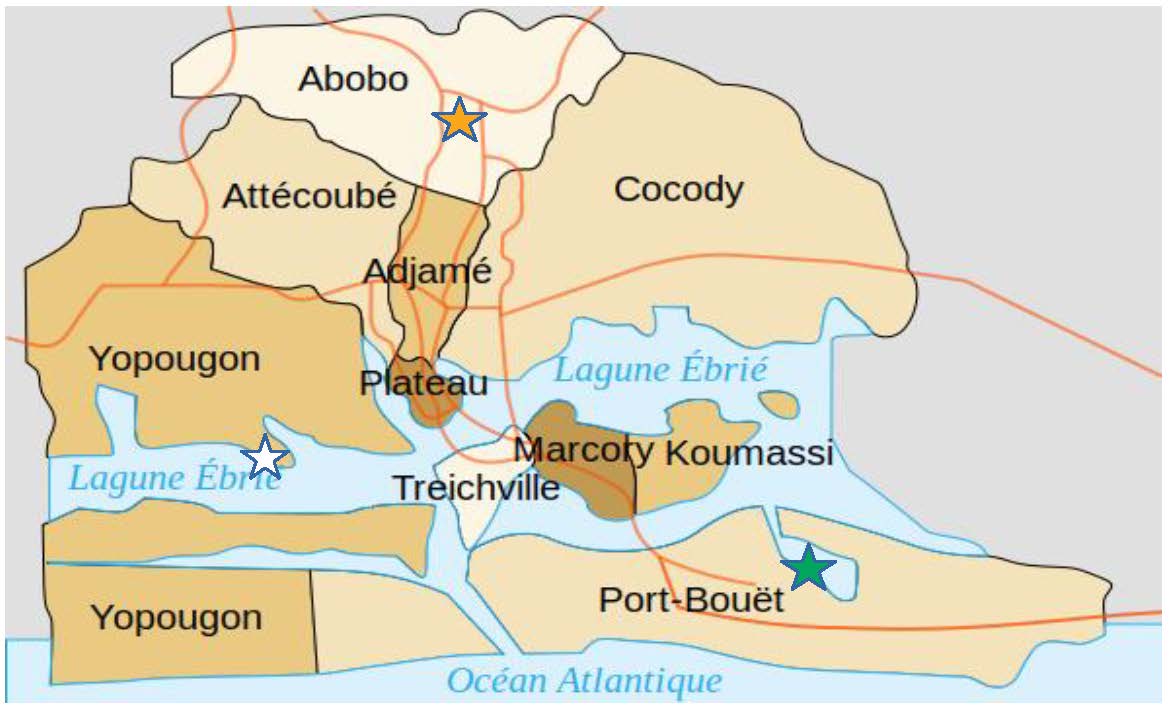
Figure 2.
(A) Minor allele frequency distribution across 89211 bi-allelic SNPs of 70 clinical isolates from Cote d’Ivoire. (B) Distribution of non-synonymous and synonymous SNPs in the population. Within-individual and within-population heterozygosities are assigned to ten equal-sized MAF bins from [0.0–0.05] to [0.45–0.5].
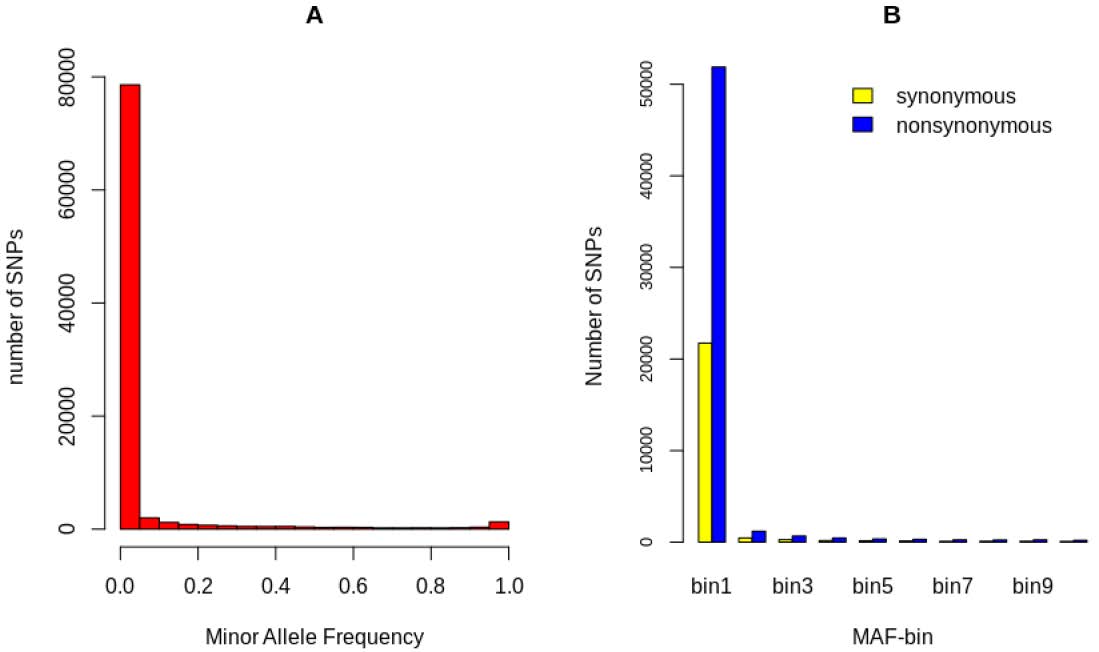
Figure 3.
Genome-wide Manhattan plot scan of standardized | iHS | for SNPs with MAF equal or greater that 5% in 70 clinical isolates from Cote d’Ivoire. Chromosomes are represented by rainbow-colored SNPs. High-scoring SNPs are located above the dashed grey line for (A) (| iHS | > 3.20; suggestive line) and (B) (| iHS | > 5.20; Bonferoni-corrected threshold), indicating loci under recent positive selection.
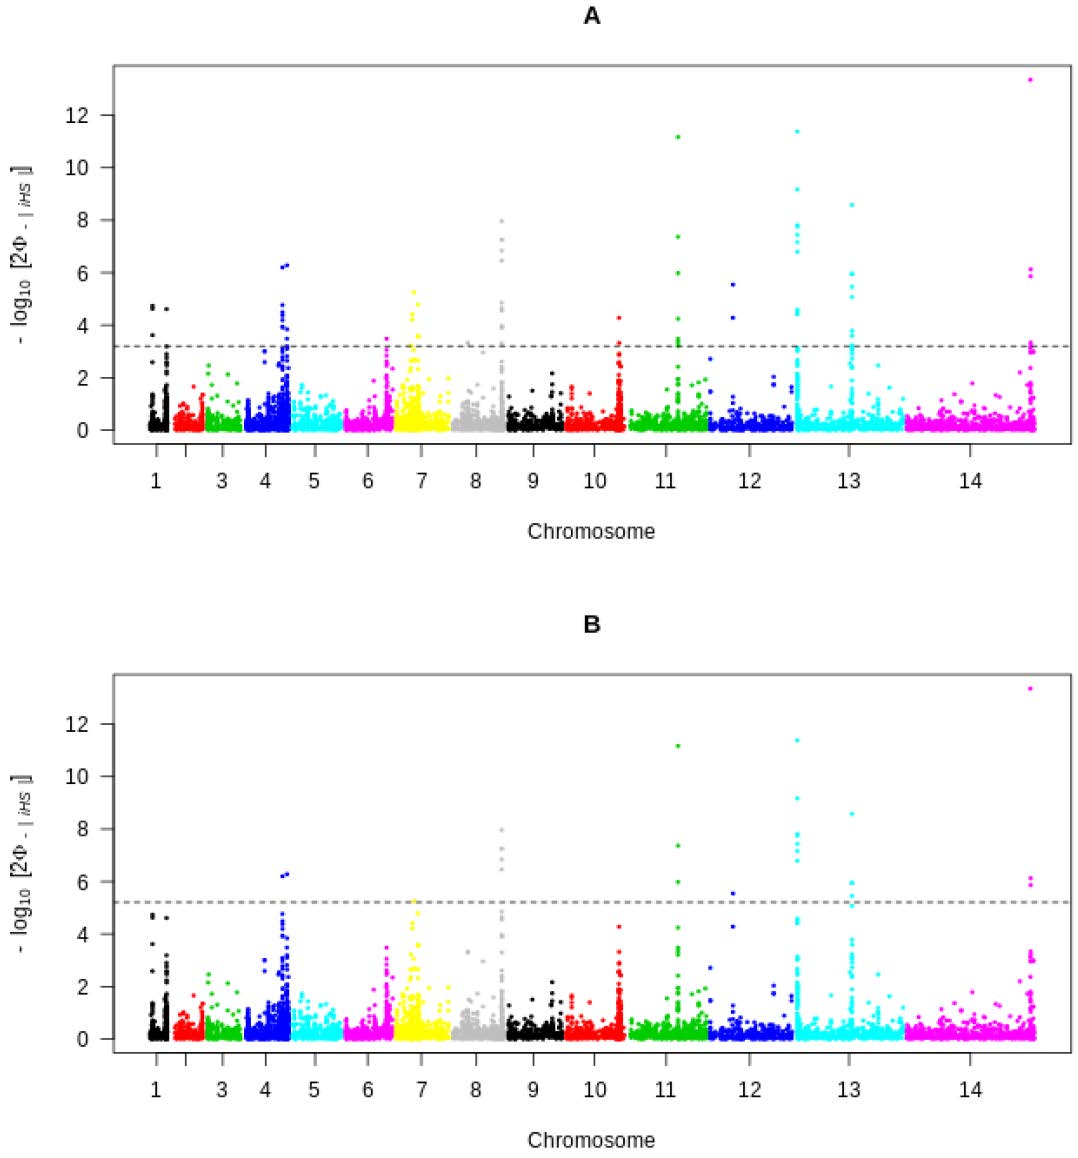
Figure 4.
Principal component analysis of 70 clinical isolates from Abidjan (Yopougon, Koumassi and Abobo) using 89578 SNPs. (A). The first and second components represent 3.2% and 4.1% of the total variation, respectively. (B). The second and third components cover 4.1% and 3.5% of the total variation, respectively.
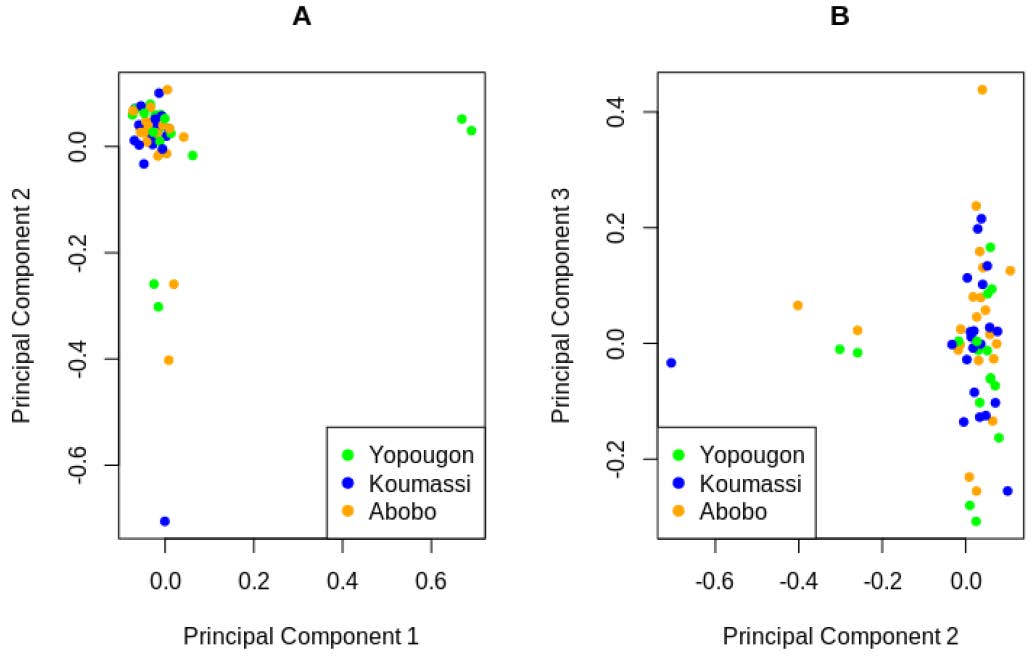
Figure 5.
Manhattan plot of genome-wide Fst values for differentiation between populations for 89211 SNPs, with each chromosome identified by alternating blue/orange colors. The red line indicates all the SNPs with Fst values above 0.2. The genome-wide Fst estimate is 0.001.
Figure 5.
Manhattan plot of genome-wide Fst values for differentiation between populations for 89211 SNPs, with each chromosome identified by alternating blue/orange colors. The red line indicates all the SNPs with Fst values above 0.2. The genome-wide Fst estimate is 0.001.
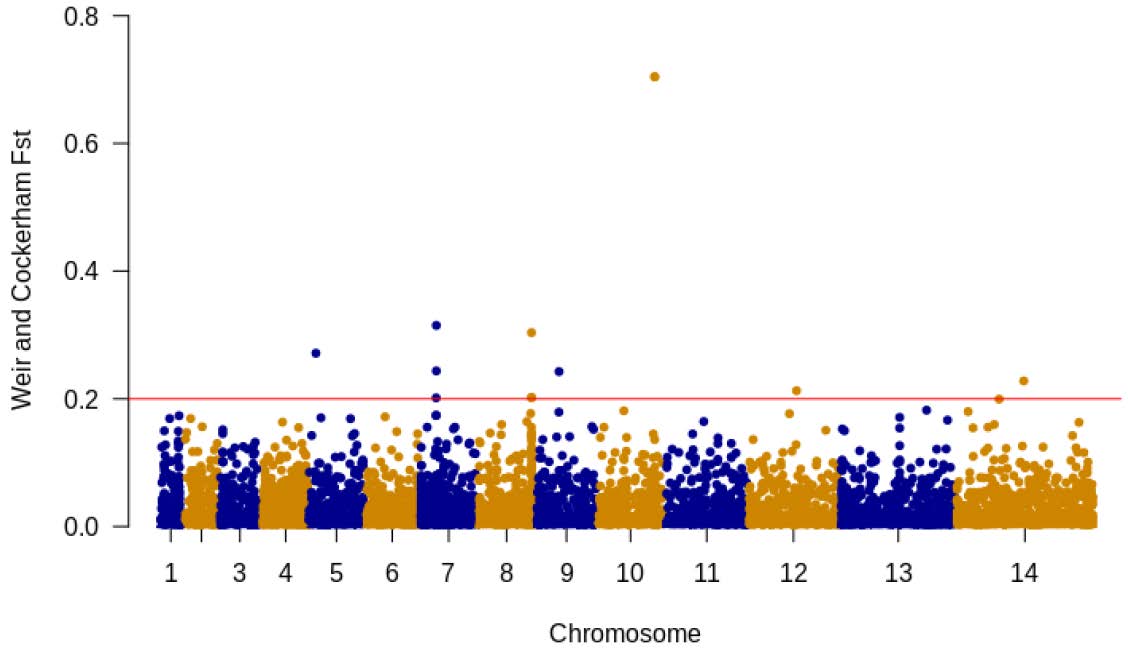

Table 1.
Genomic windows of | iHS | values greater than 3.20 (suggestive) line and greater than 5 (Bonferoni-corrected threshold). Windows overlapping Pfcrt and Pfdhps are highlighted in bold.
Table 1.
Genomic windows of | iHS | values greater than 3.20 (suggestive) line and greater than 5 (Bonferoni-corrected threshold). Windows overlapping Pfcrt and Pfdhps are highlighted in bold.
| Chromosome | Window Start (kb) | Window End (kb) | Region Size (kb) | Number of Supporting SNPs | Genes within Region |
|---|---|---|---|---|---|
| 1 | 180 | 530 | 350 | 4 | PF3D7_0104100-PF3D7_0113800 |
| 4 | 987 | 1100 | 113 | 10 | PF3D7_0421700-PF3D7_0424300 |
| 7 | 400 | 610 | 210 | 8 | PF3D7_0708900-PF3D7_0713300 |
| 8 | 468 | 1312 | 844 | 14 | PF3D7_0809200-PF3D7_0830800 |
| 10 | 1396 | 1410 | 14 | 2 | PF3D7_1035200-PF3D7_1035400 |
| 11 | 1274 | 1295 | 21 | 7 | PF3D7_1132900-PF3D7_1133400 |
| 13 | 106 | 1466 | 1360 | 18 | PF3D7_1301800-PF3D7_1335900 |
Table 2.
Most differentiated SNPs allele frequencies between the three populations.
| Chromosome | SNP Position | Gene | Reference Allele Frequency | Fst | Coding Effect | Amino Acid Change |
|---|---|---|---|---|---|---|
| 5 | 192222 | PF3D7_0504800 | 0.36 | 0.27 | Non-synonymous | N4171D |
| 7 | 430364 | PF3D7_0709600 | 0.57 | 0.2 | Synonymous | - |
| 7 | 435368 | PF3D7_0709700 | 0.53 | 0.24 | Non-synonymous | T968A |
| 7 | 435497 | PF3D7_0709700 | 0.54 | 0.31 | Synonymous | - |
| 8 | 1311574 | PF3D7_0830800 | 0.88 | 0.2 | Non-synonymous | F313Y |
| 8 | 1311584 | PF3D7_0830800 | 0.88 | 0.2 | Synonymous | - |
| 8 | 1311619 | PF3D7_0830800 | 0.89 | 0.3 | Non-synonymous | E328A |
| 9 | 600149 | PF3D7_0914000 | 0.24 | 0.24 | Non-synonymous | T819I |
| 10 | 1394930 | PF3D7_1035200 | 0.27 | 0.7 | Non-synonymous | G31E |
| 10 | 1394950 | PF3D7_1035200 | 0.28 | 0.7 | Non-synonymous | A38T |
| 12 | 1183319 | PF3D7_1228900 | 0.81 | 0.21 | Non-synonymous | V369E |
| 14 | 1618596 | Intergenic | 0.43 | 0.22 | - | - |
© 2023 Copyright by Authors. Licensed as an open access article using a CC BY 4.0 license.